PULSE project
PULSE project

Challenge
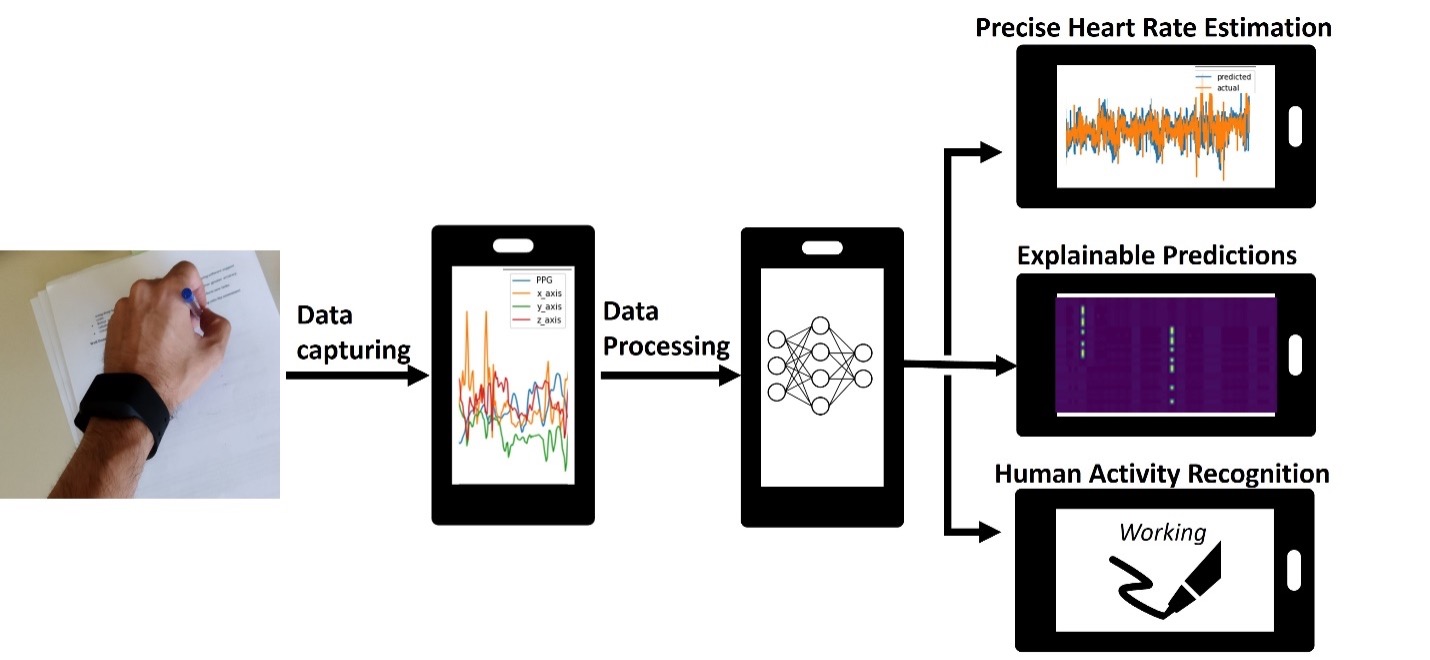
Time Series Analysis provides details on a signal such that condition information can be estimated. It has important application within Patient Monitoring for human Heart Rate Detection, providing heart rate information compensated for movement. In particular, a PPG (photoplethysmography) is a widely used sensor to estimate heart rate and is placed on wearable devices (smartwatches). A PPG sensor observes the capillaries in the wrist which fill with blood when the heart ventricles contract. The light emitted by the PPG sensor is absorbed by red blood cells in these capillaries and a photodetector will see the drop in reflected light. When the blood returns to the heart, fewer red blood cells in the wrist absorb the light and the photodetector sees an increase in reflected light. The period of this oscillating waveform provides the pulse rate. When the PPG is combined with a 3-axis accelerometer in a wearable can provide robust and meaningful under real world conditions information for patients in all activity levels from rest to extreme levels of movement.
Solution
PULSE is based on a deep learning model that takes as input PPG signals originated by wearable devices (e.g., smartwatch) and fuse them with triaxial accelerometer signals to estimate the user’s heart rate. The model relies on several dilated 1D convolutions followed by a multi-head attention layer that is able to extract correlation between the PPG and accelerometers signals, providing also attentional maps that can be used as a form of explanations.
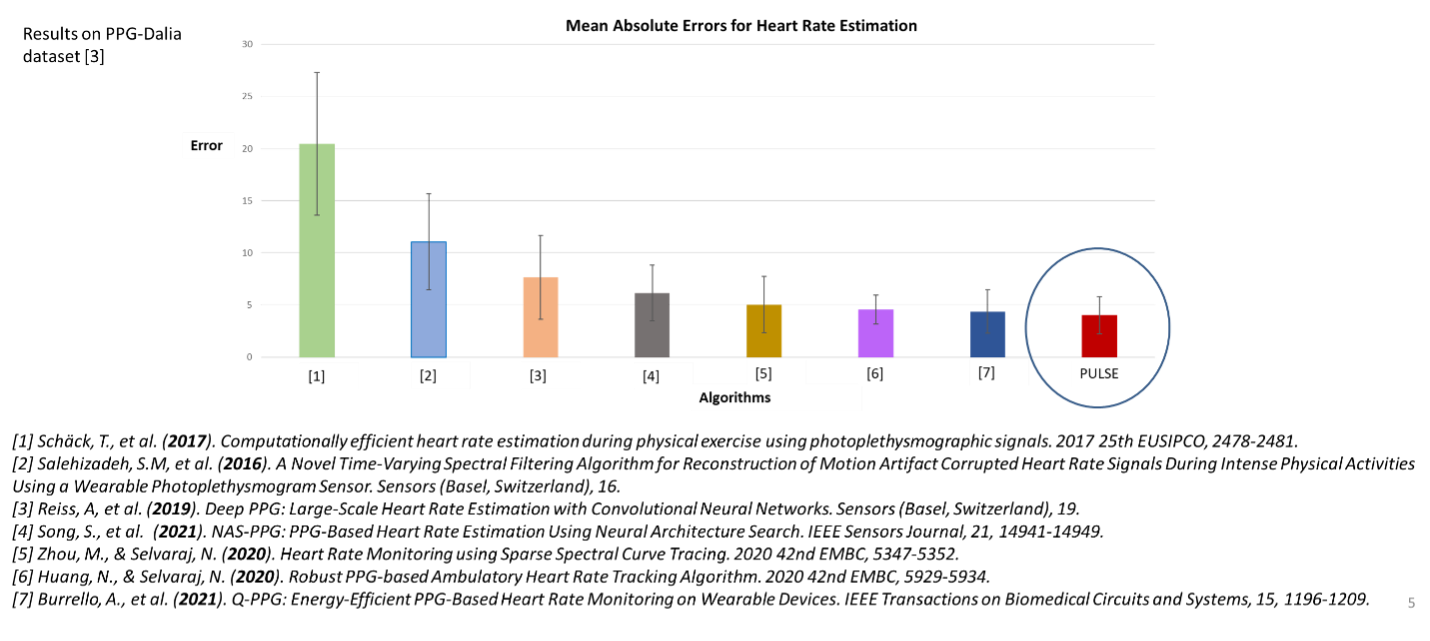
PULSE compared to state-of-the-art
The developed model outperforms state of-the-art algorithms using Mean Absolute Error (MAE) as metric, while it is very light weight and is able to run in real-time on low-power edge devices.
Ambition towards personalization
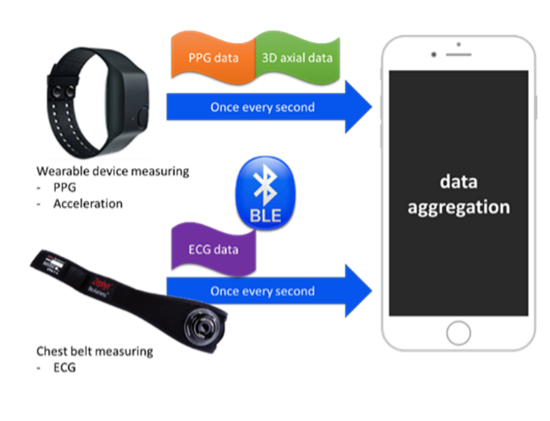
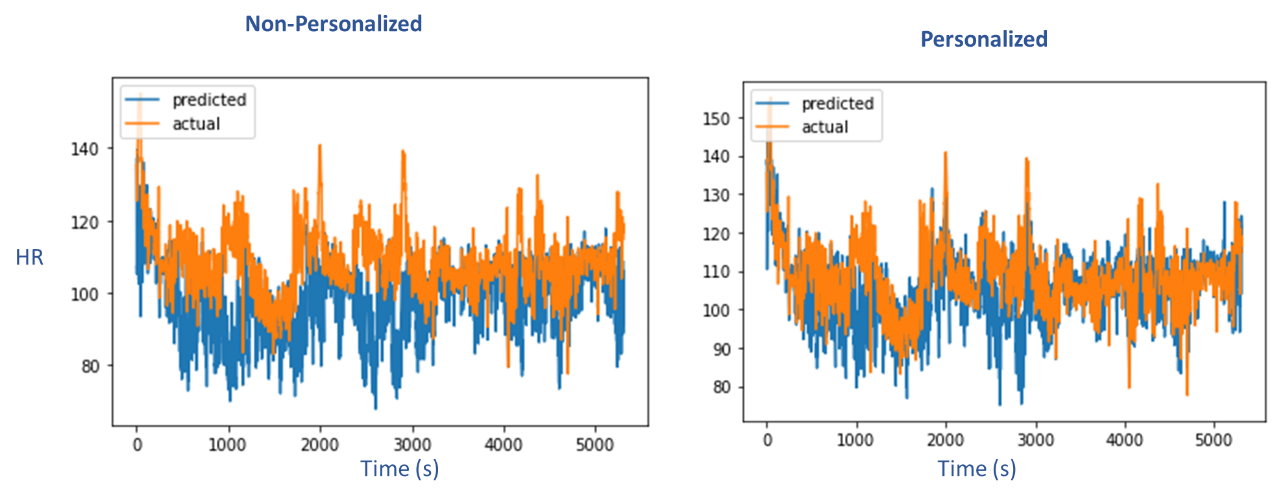
During the lifetime of the project, we collected a dataset consisting of the raw 3axial accelerometer, the PPG signals and the corresponding target (actual) value of heart-rate using a smart belt (e.g., Zephyr BioHarness 3.0). The data were collected by a mobile phone connected to the devices over BLE and sent to a local server. 5 subjects participated collecting with more than 14hours of data (~25,000 examples).
Subsequently, we evaluated ways for developing personalized model to increase performance. This was accomplished by asking the user to wear a smart belt and a wearable for 10 minutes and finetuning the PULSE model afterwards. The results show decrease on MAE by 1.18 on average (for 5 subjects). The following figure displays the obtained results before and after the personalization step.
Video:
Paper:
https://arxiv.org/abs/2210.11415